Dignity in America
Key Takeaways
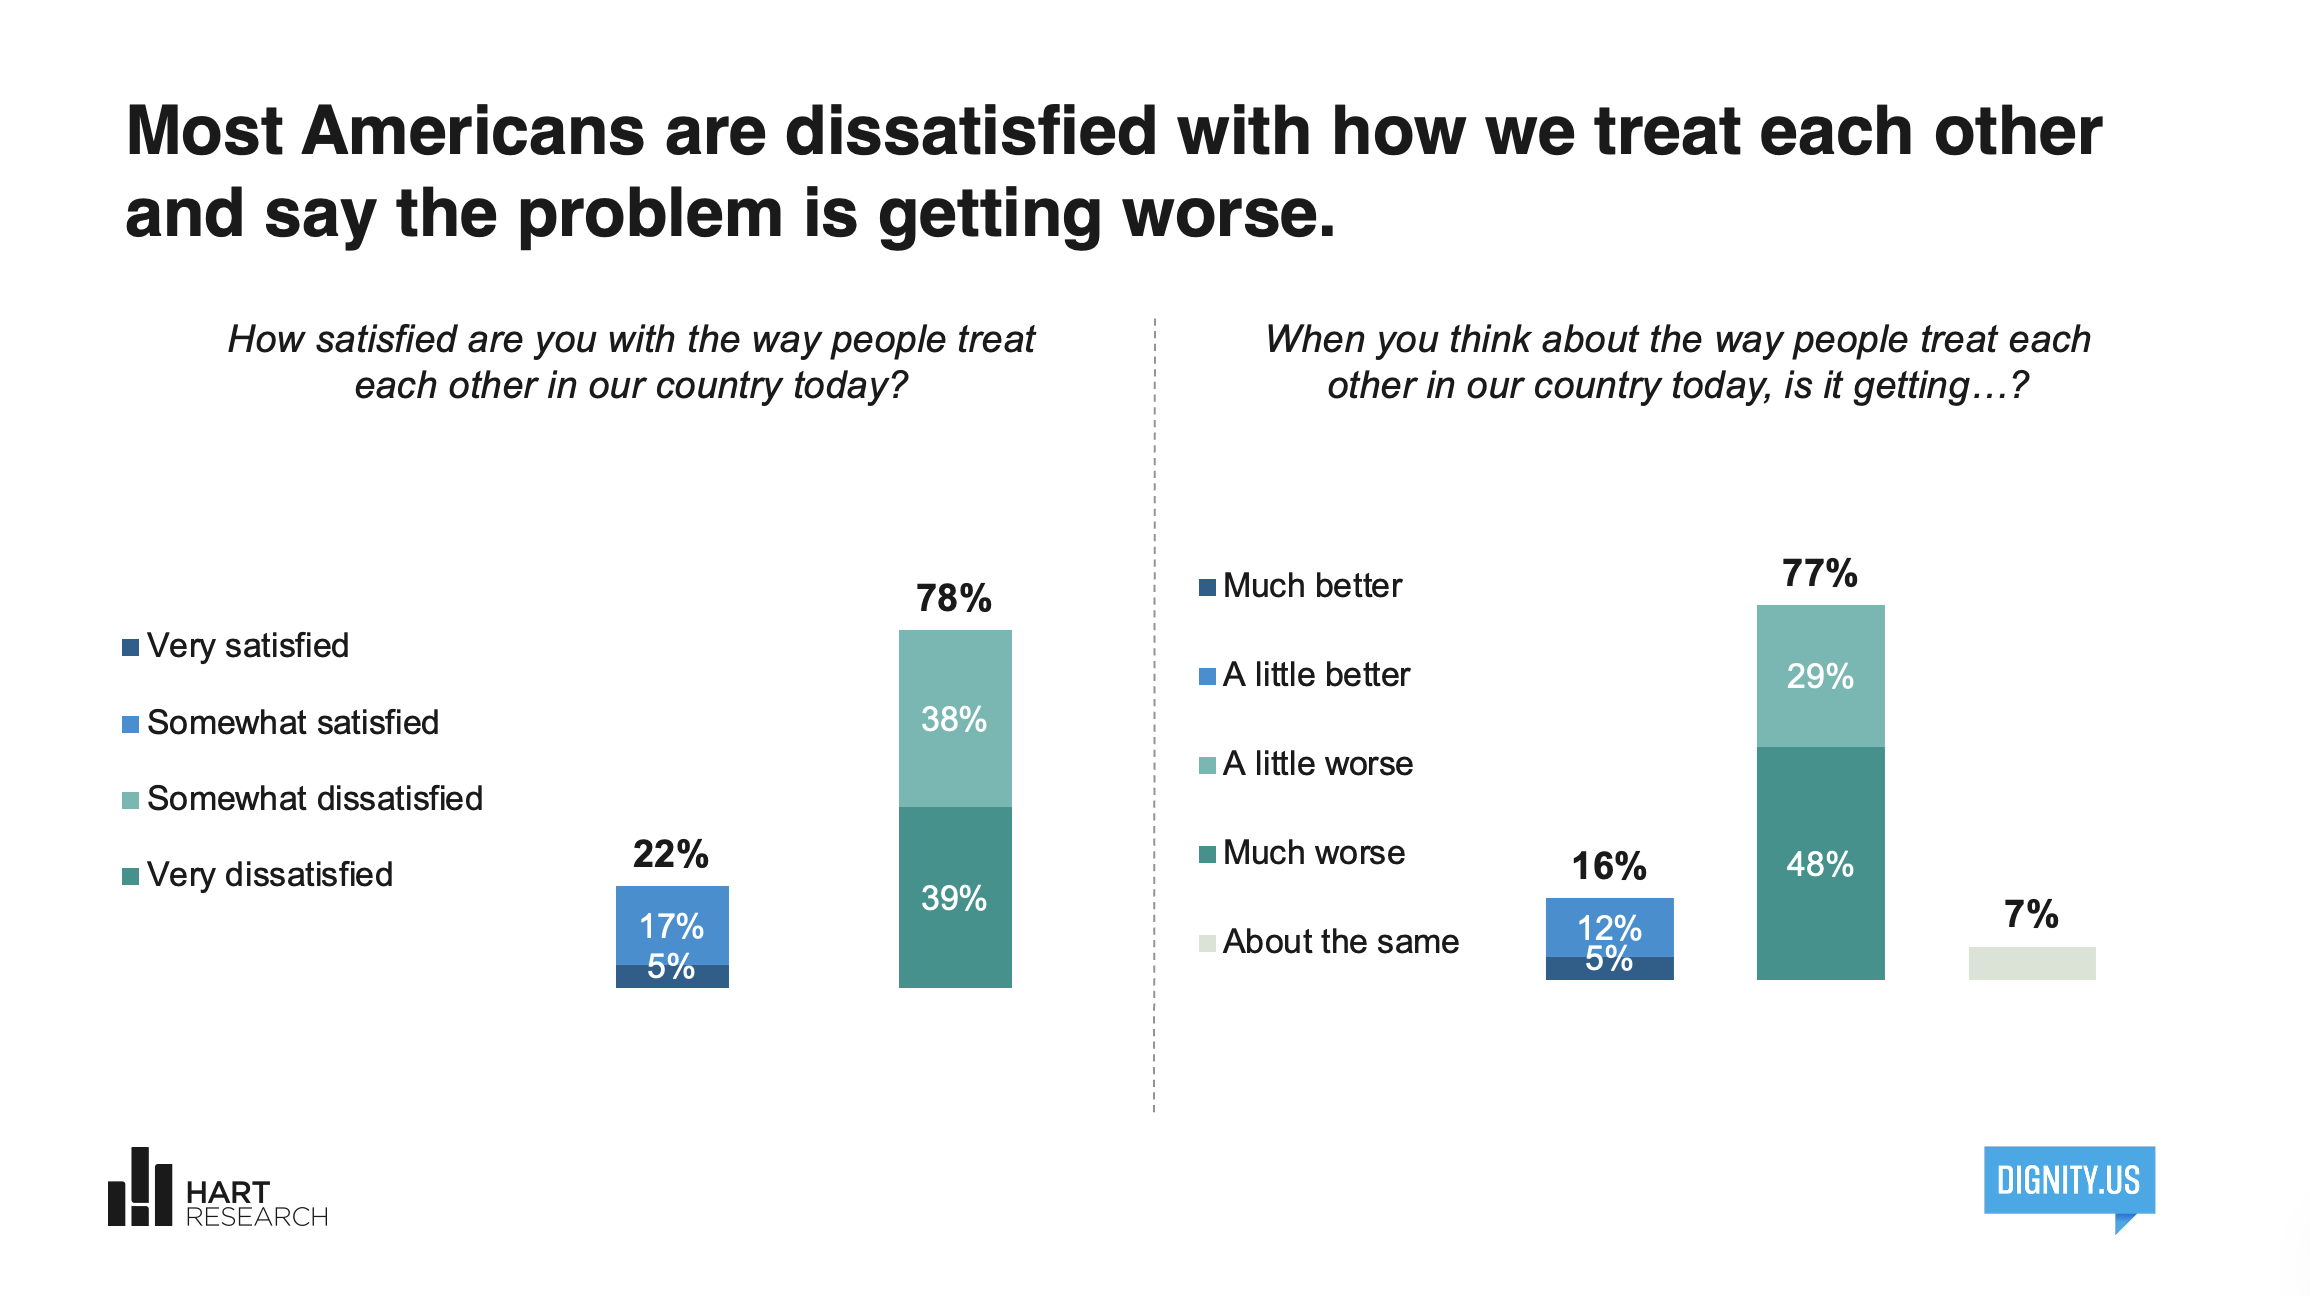
Americans are Dissatisfied
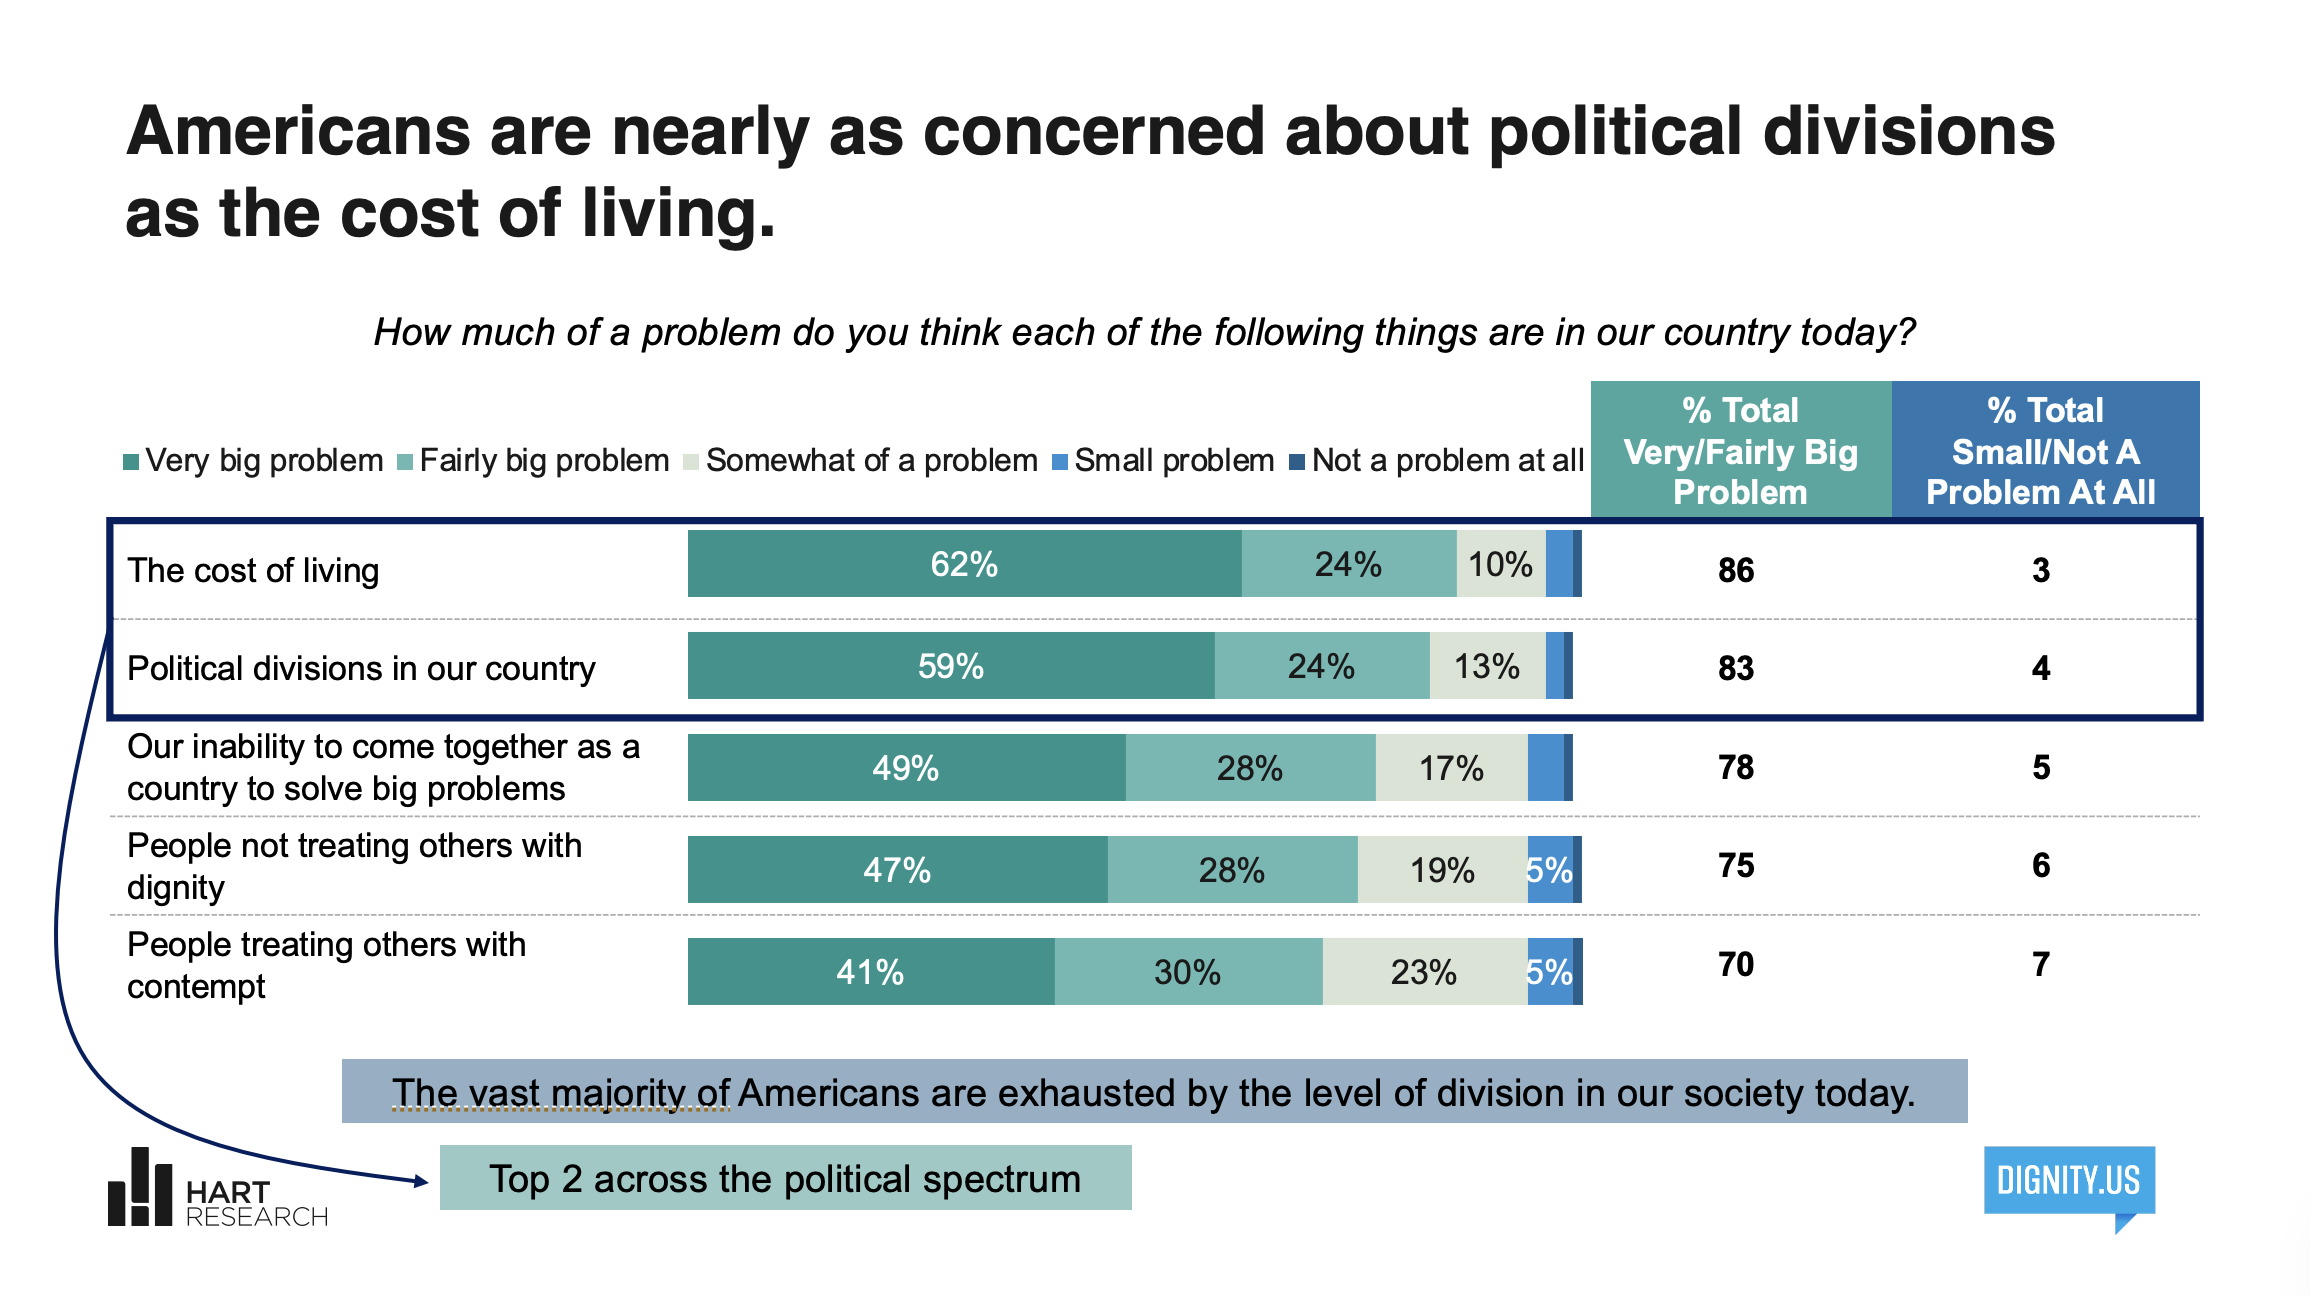
Political Division is a Kitchen-Table Crisis
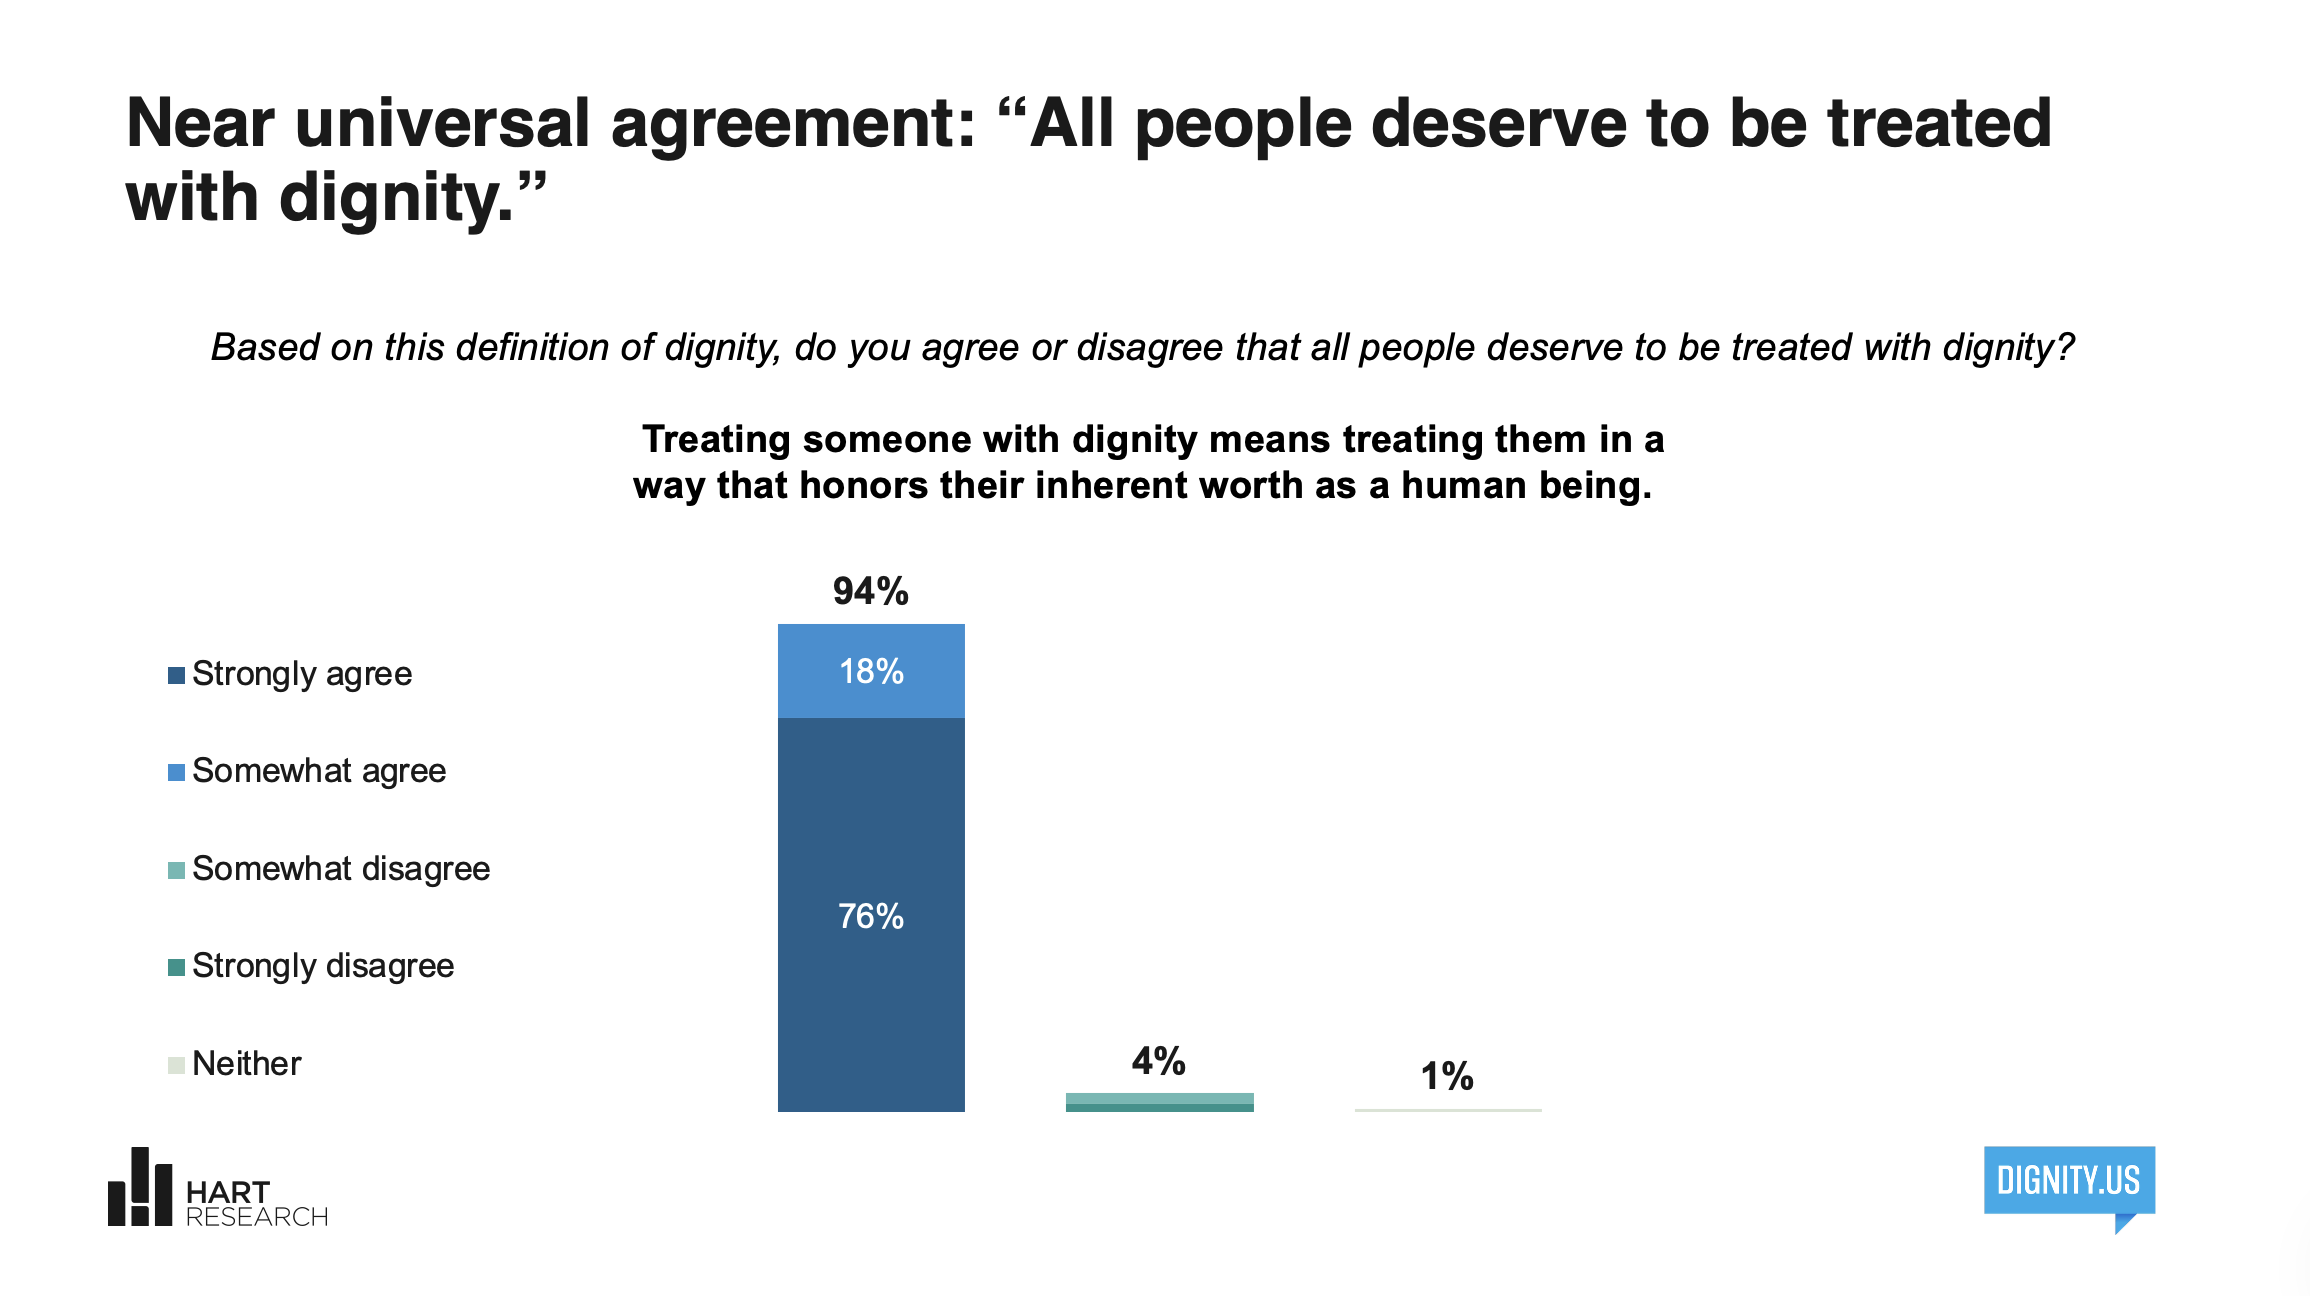
Agreement on Dignity
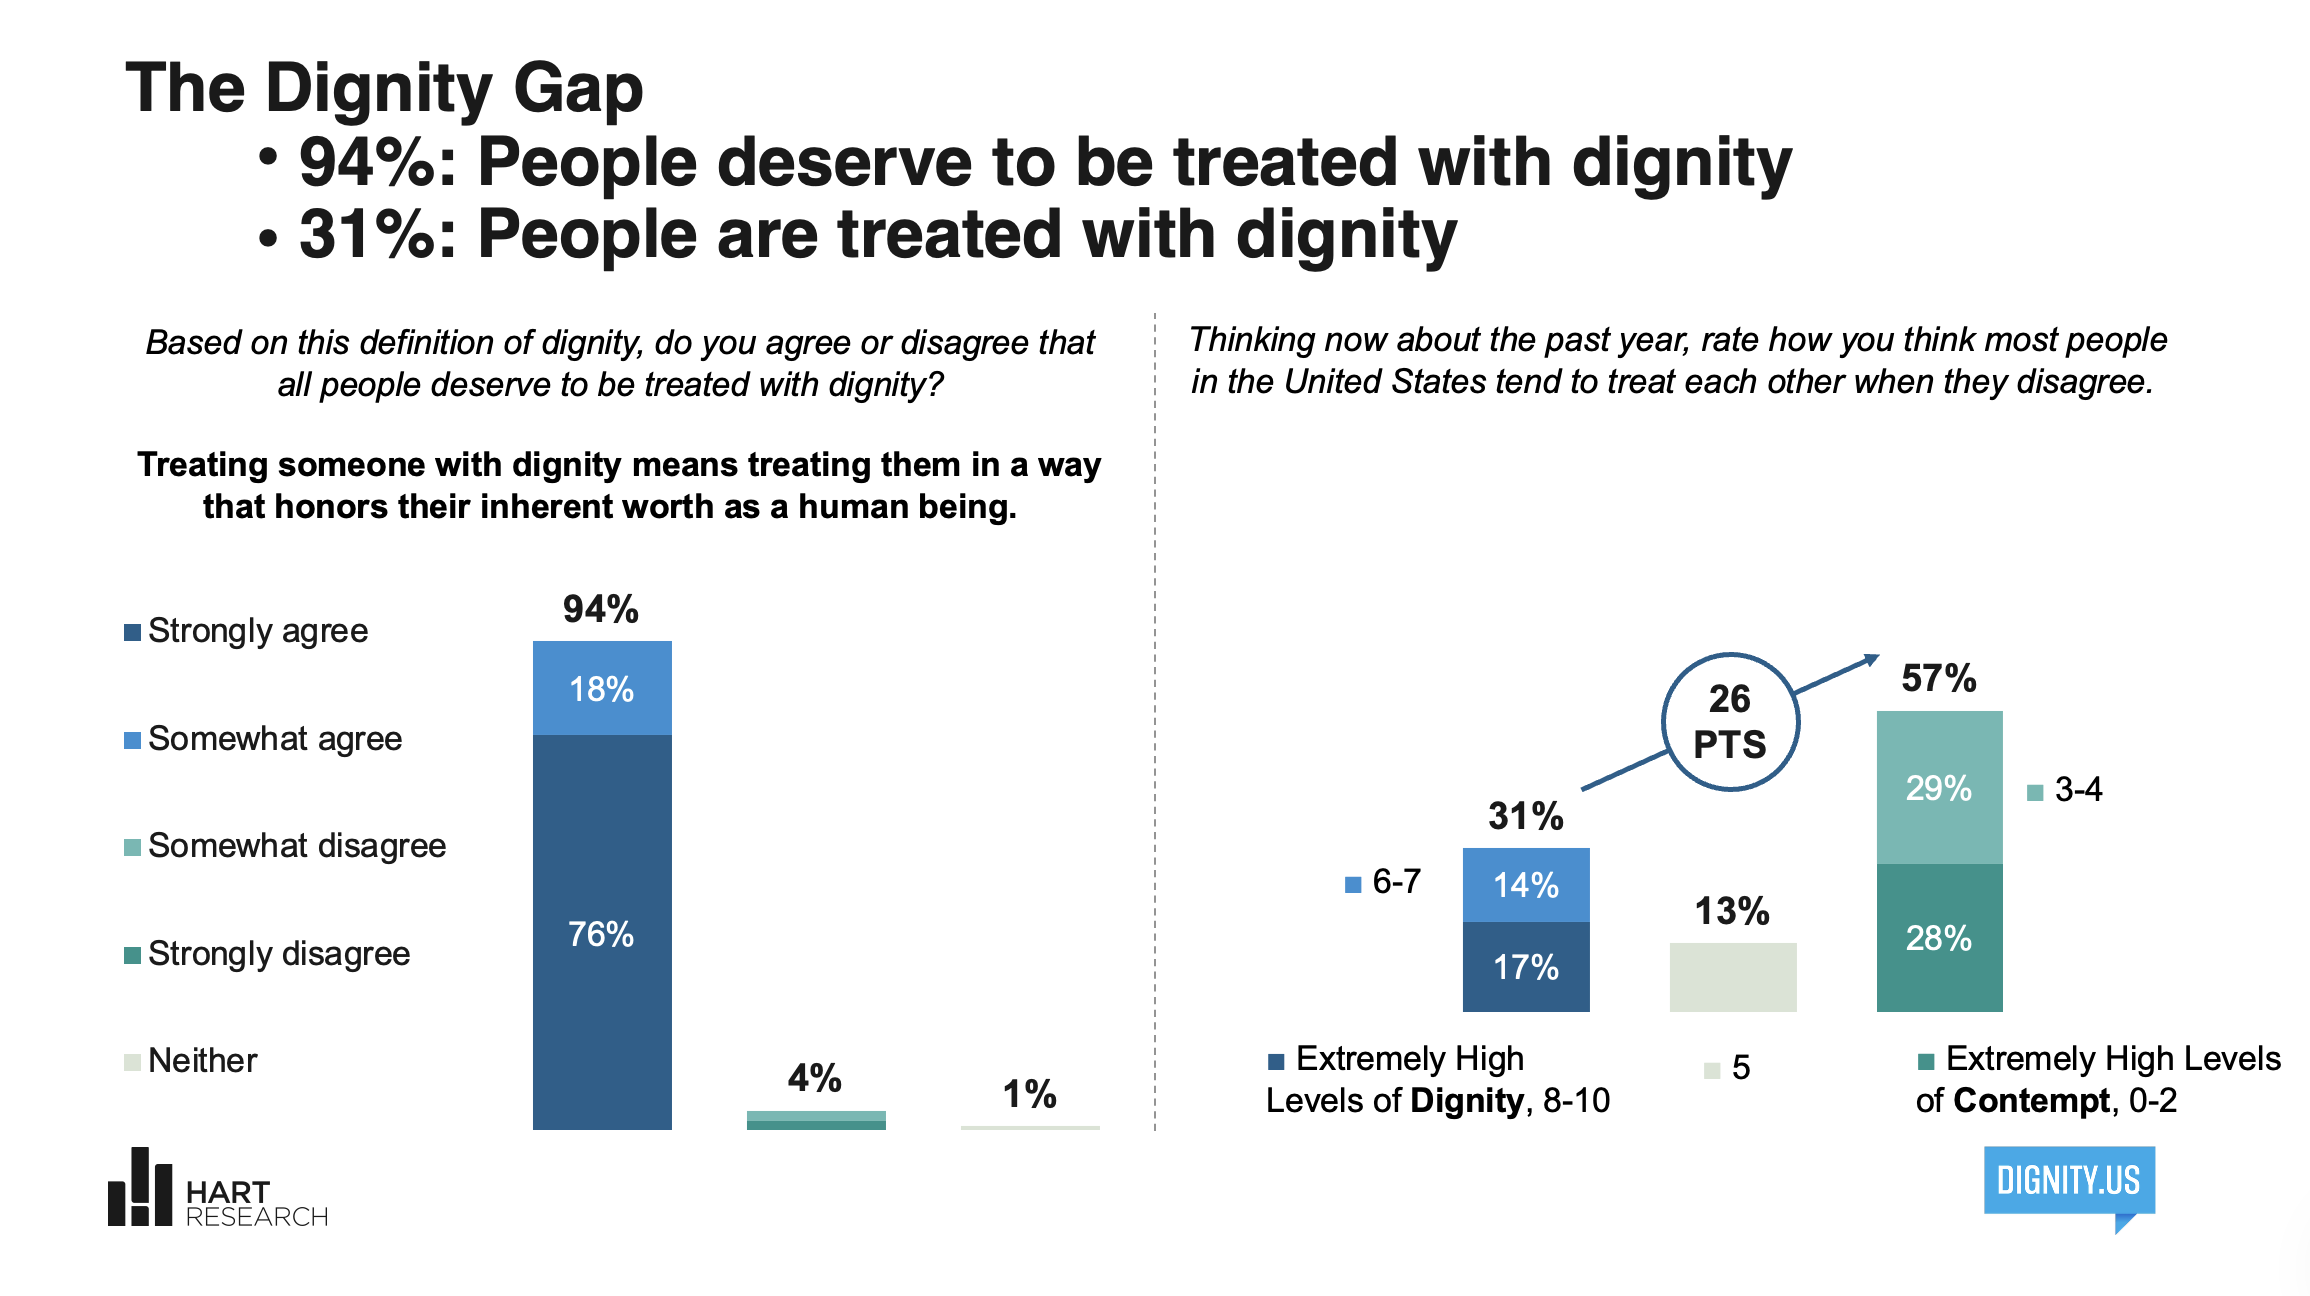
The Dignity Gap
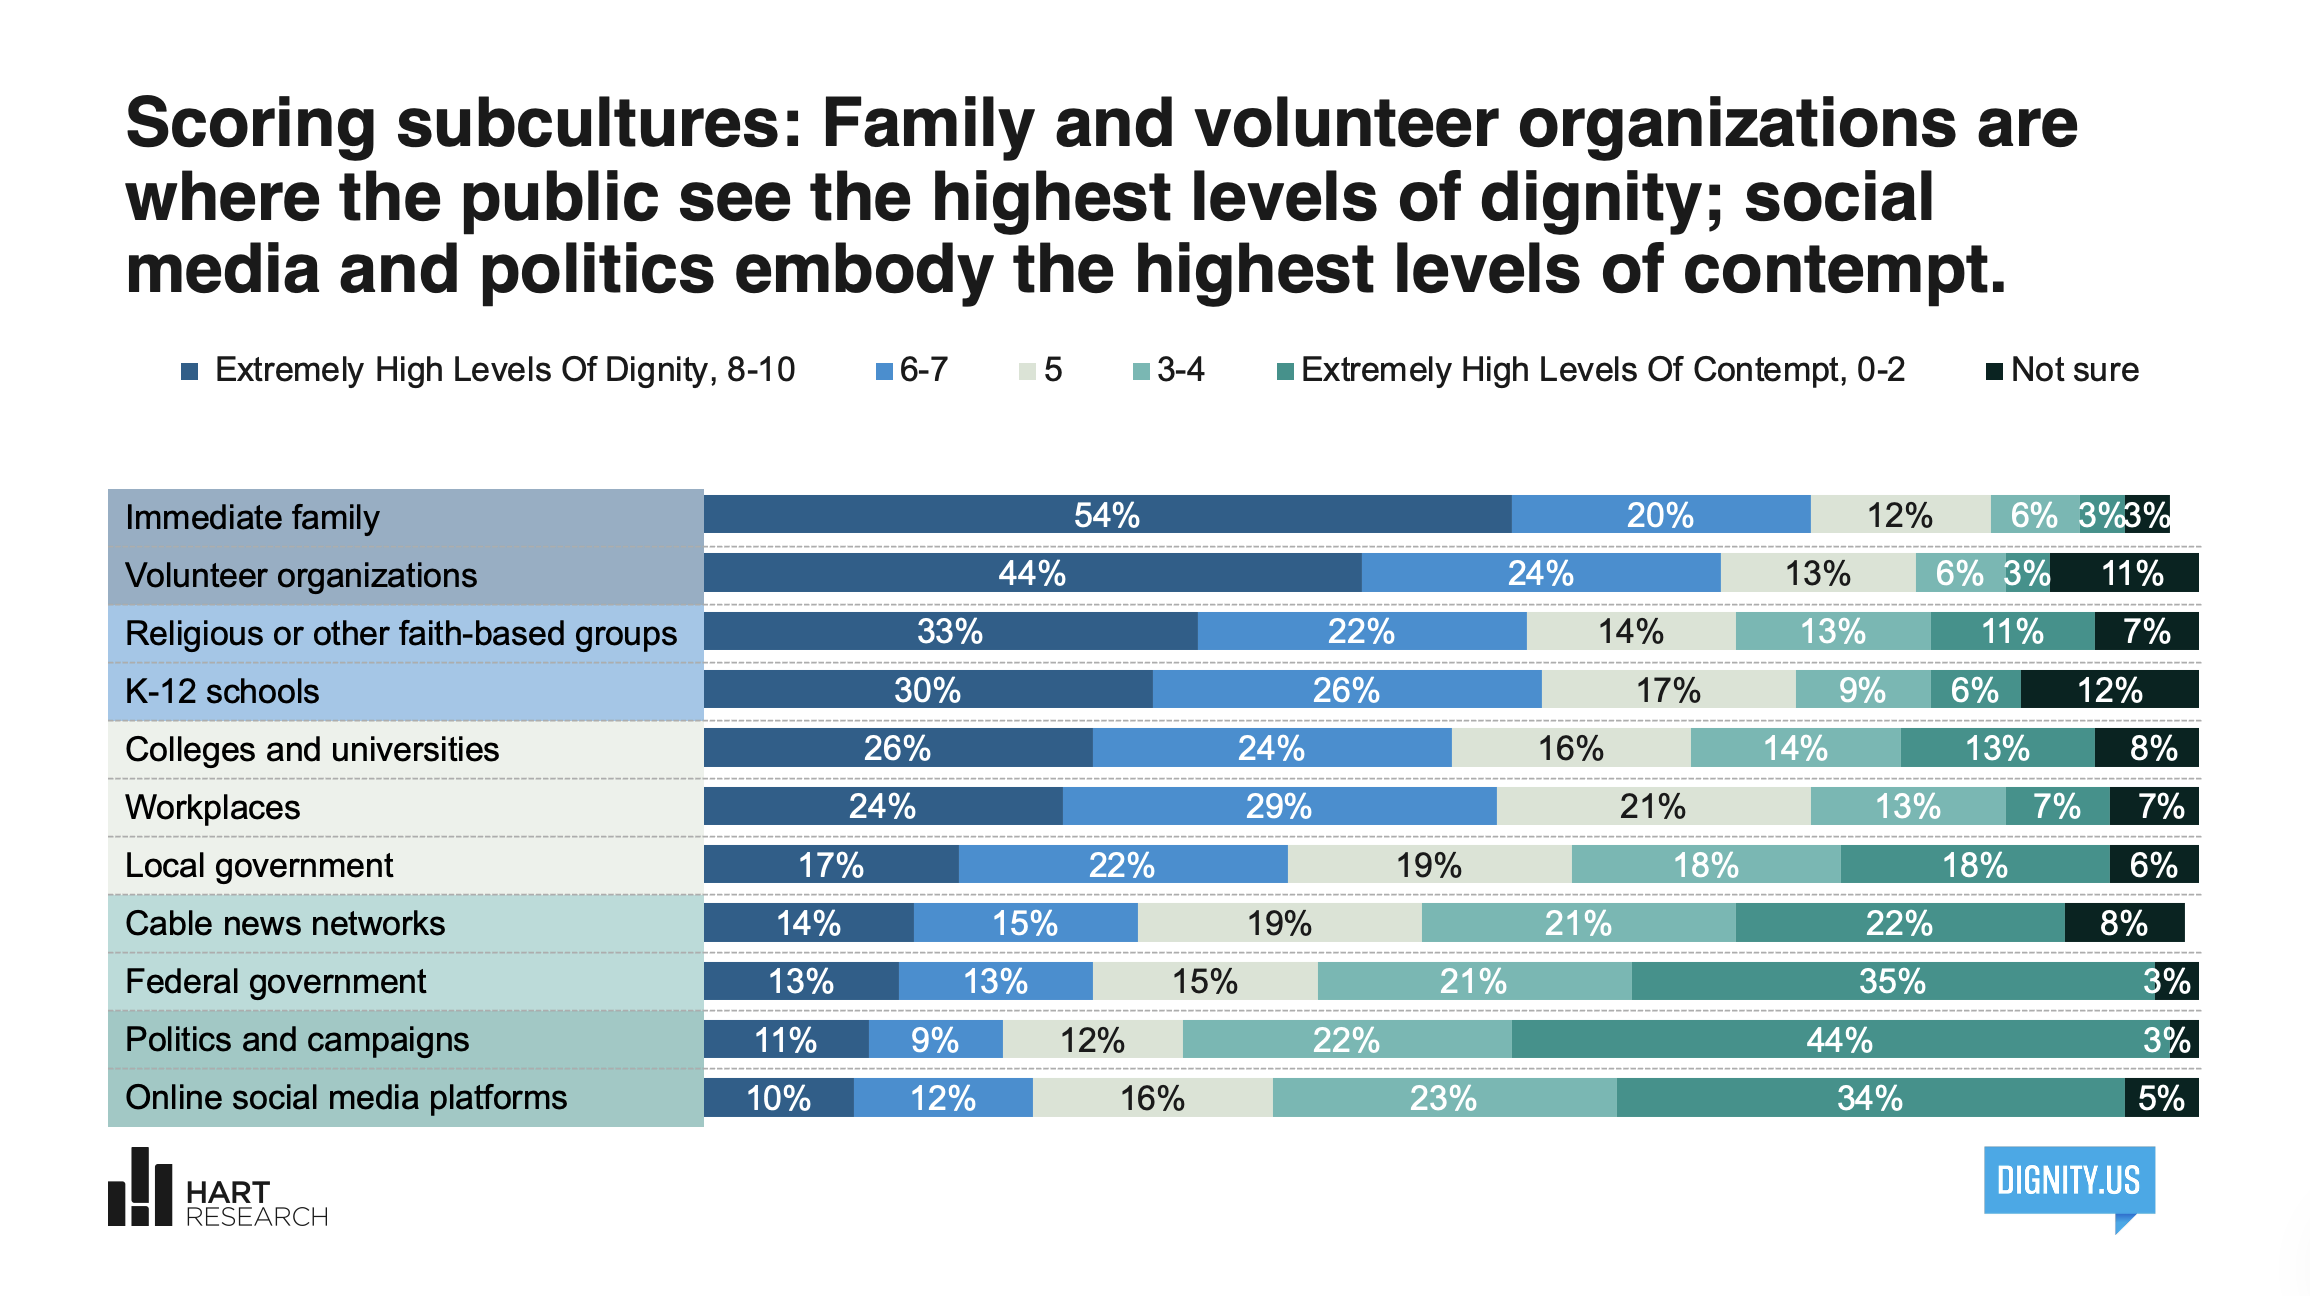
Levels of Dignity Vary by Subculture
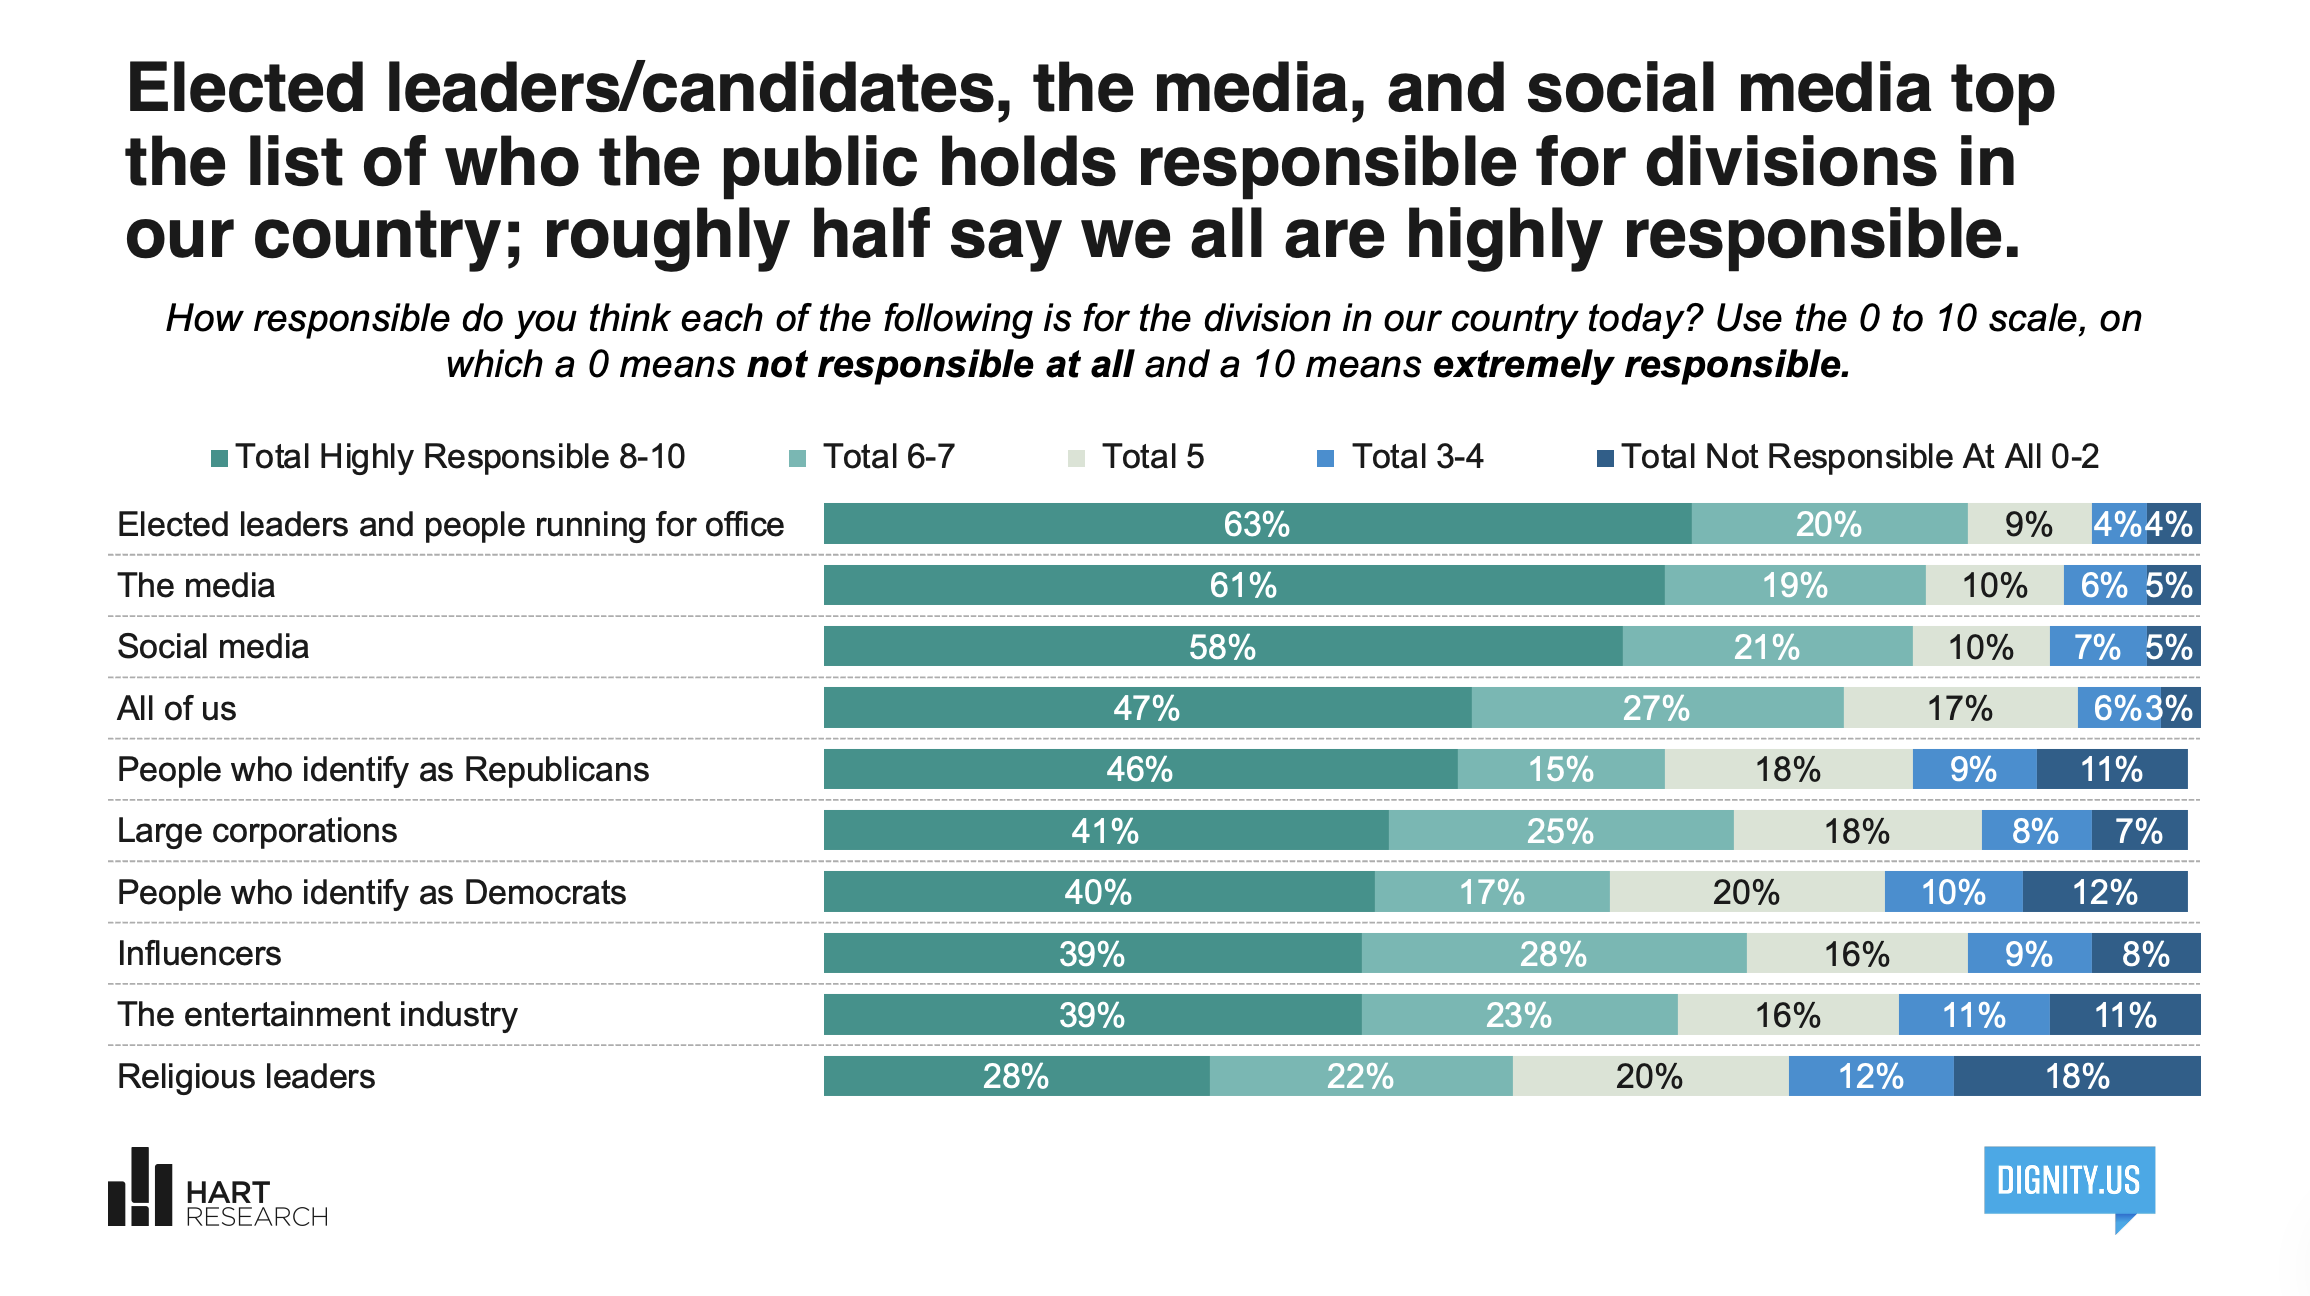
Who is Responsible?
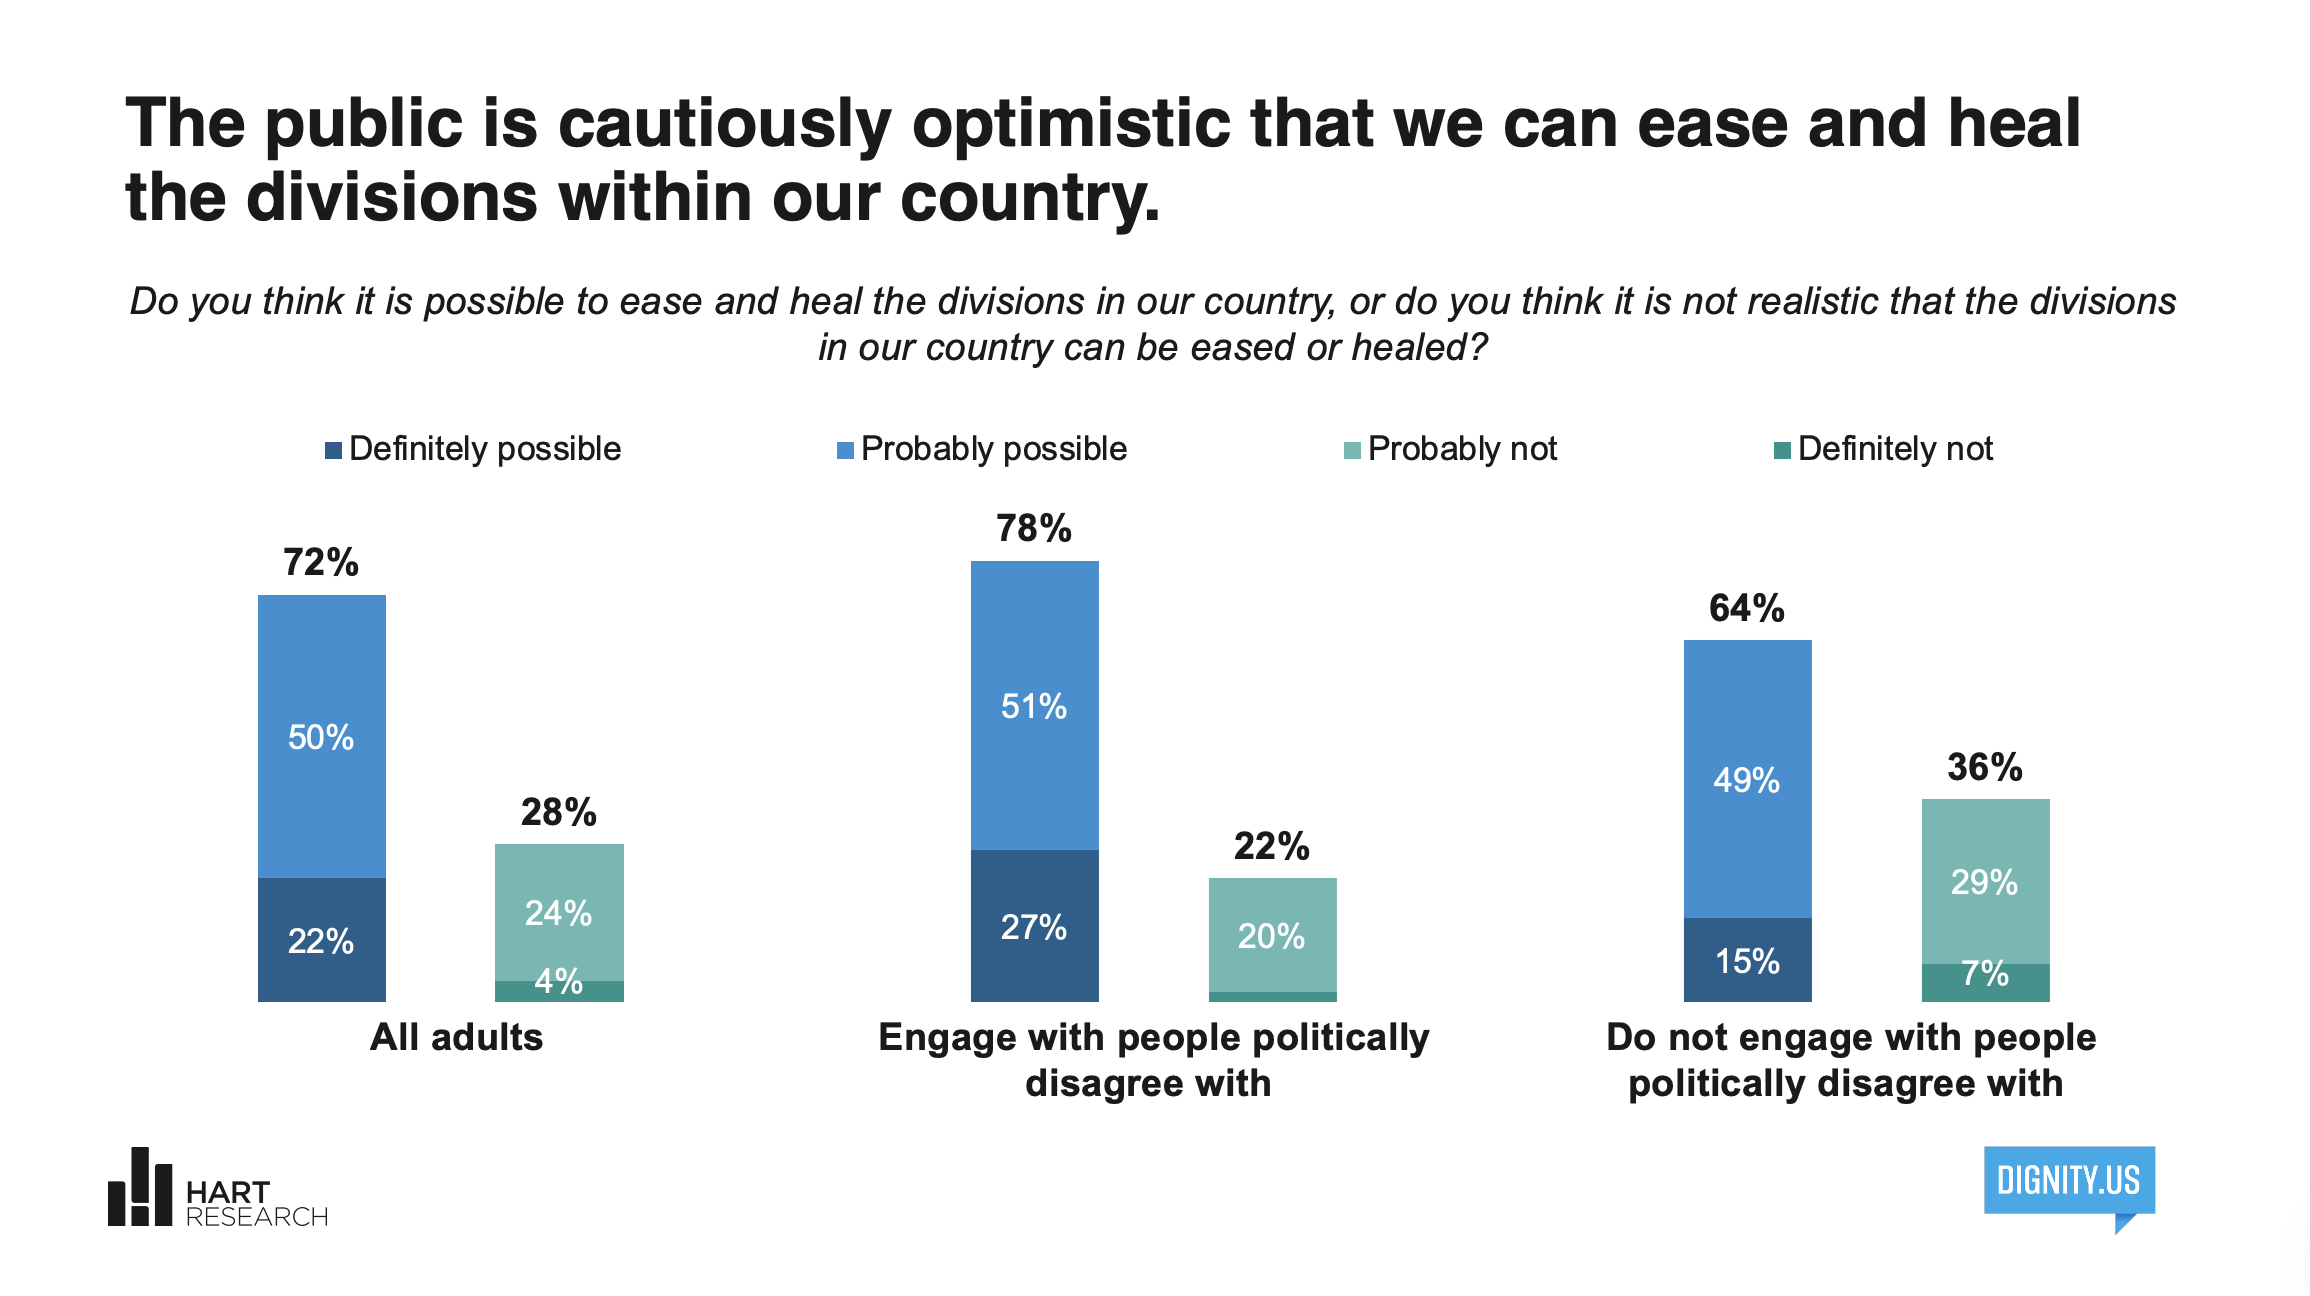
Reason for Optimism
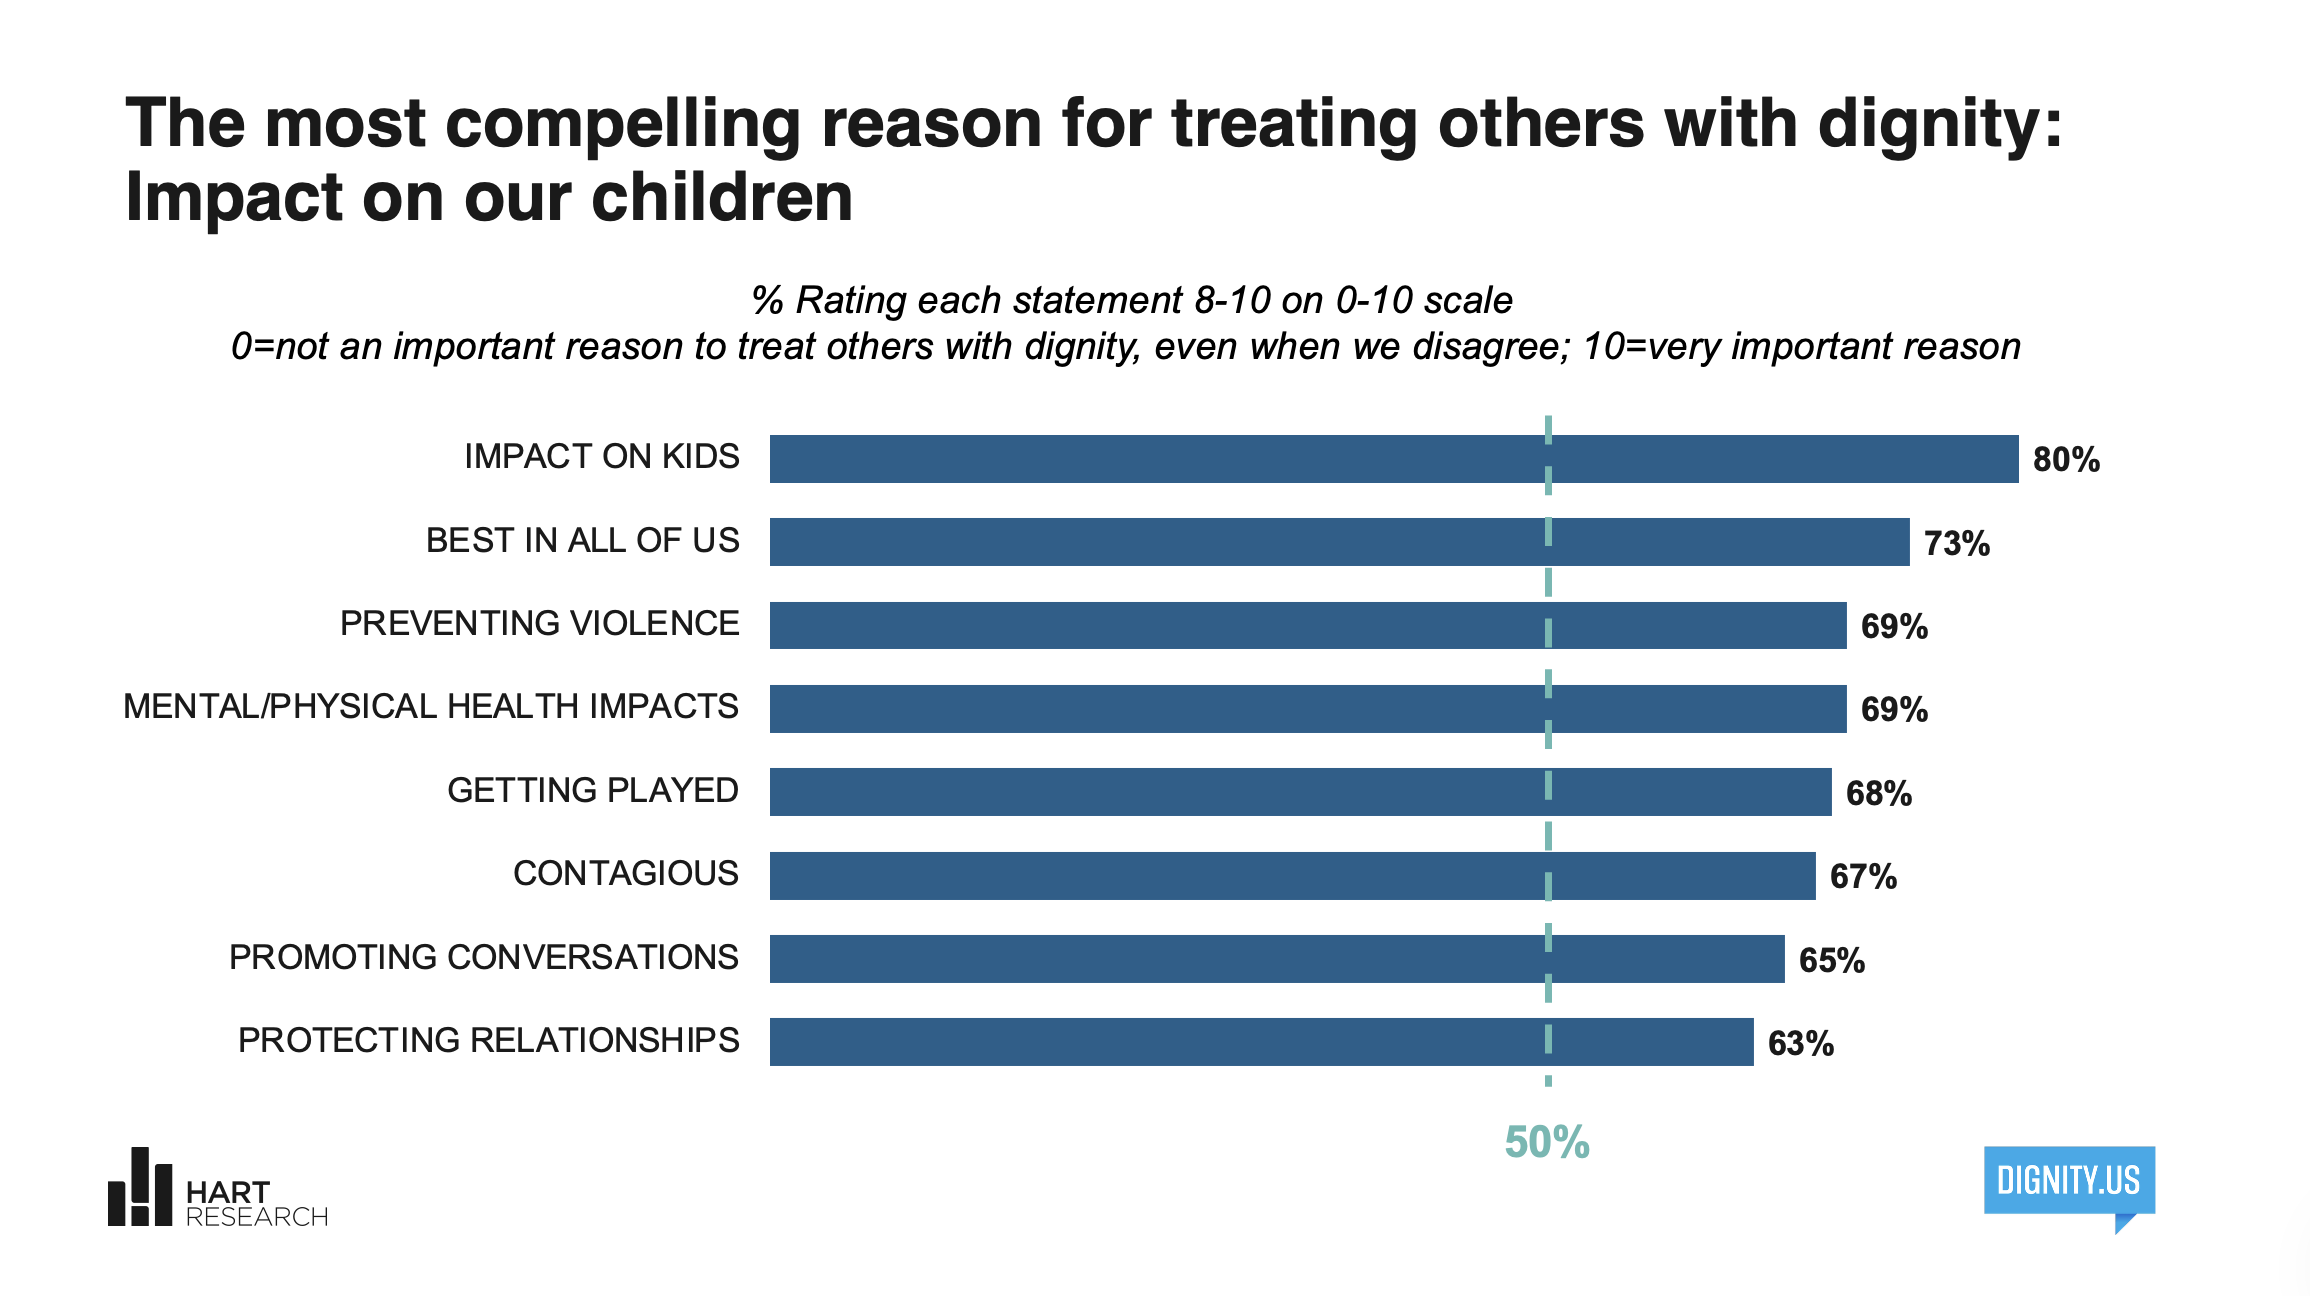
Americans Most Concerned About Impact on Kids
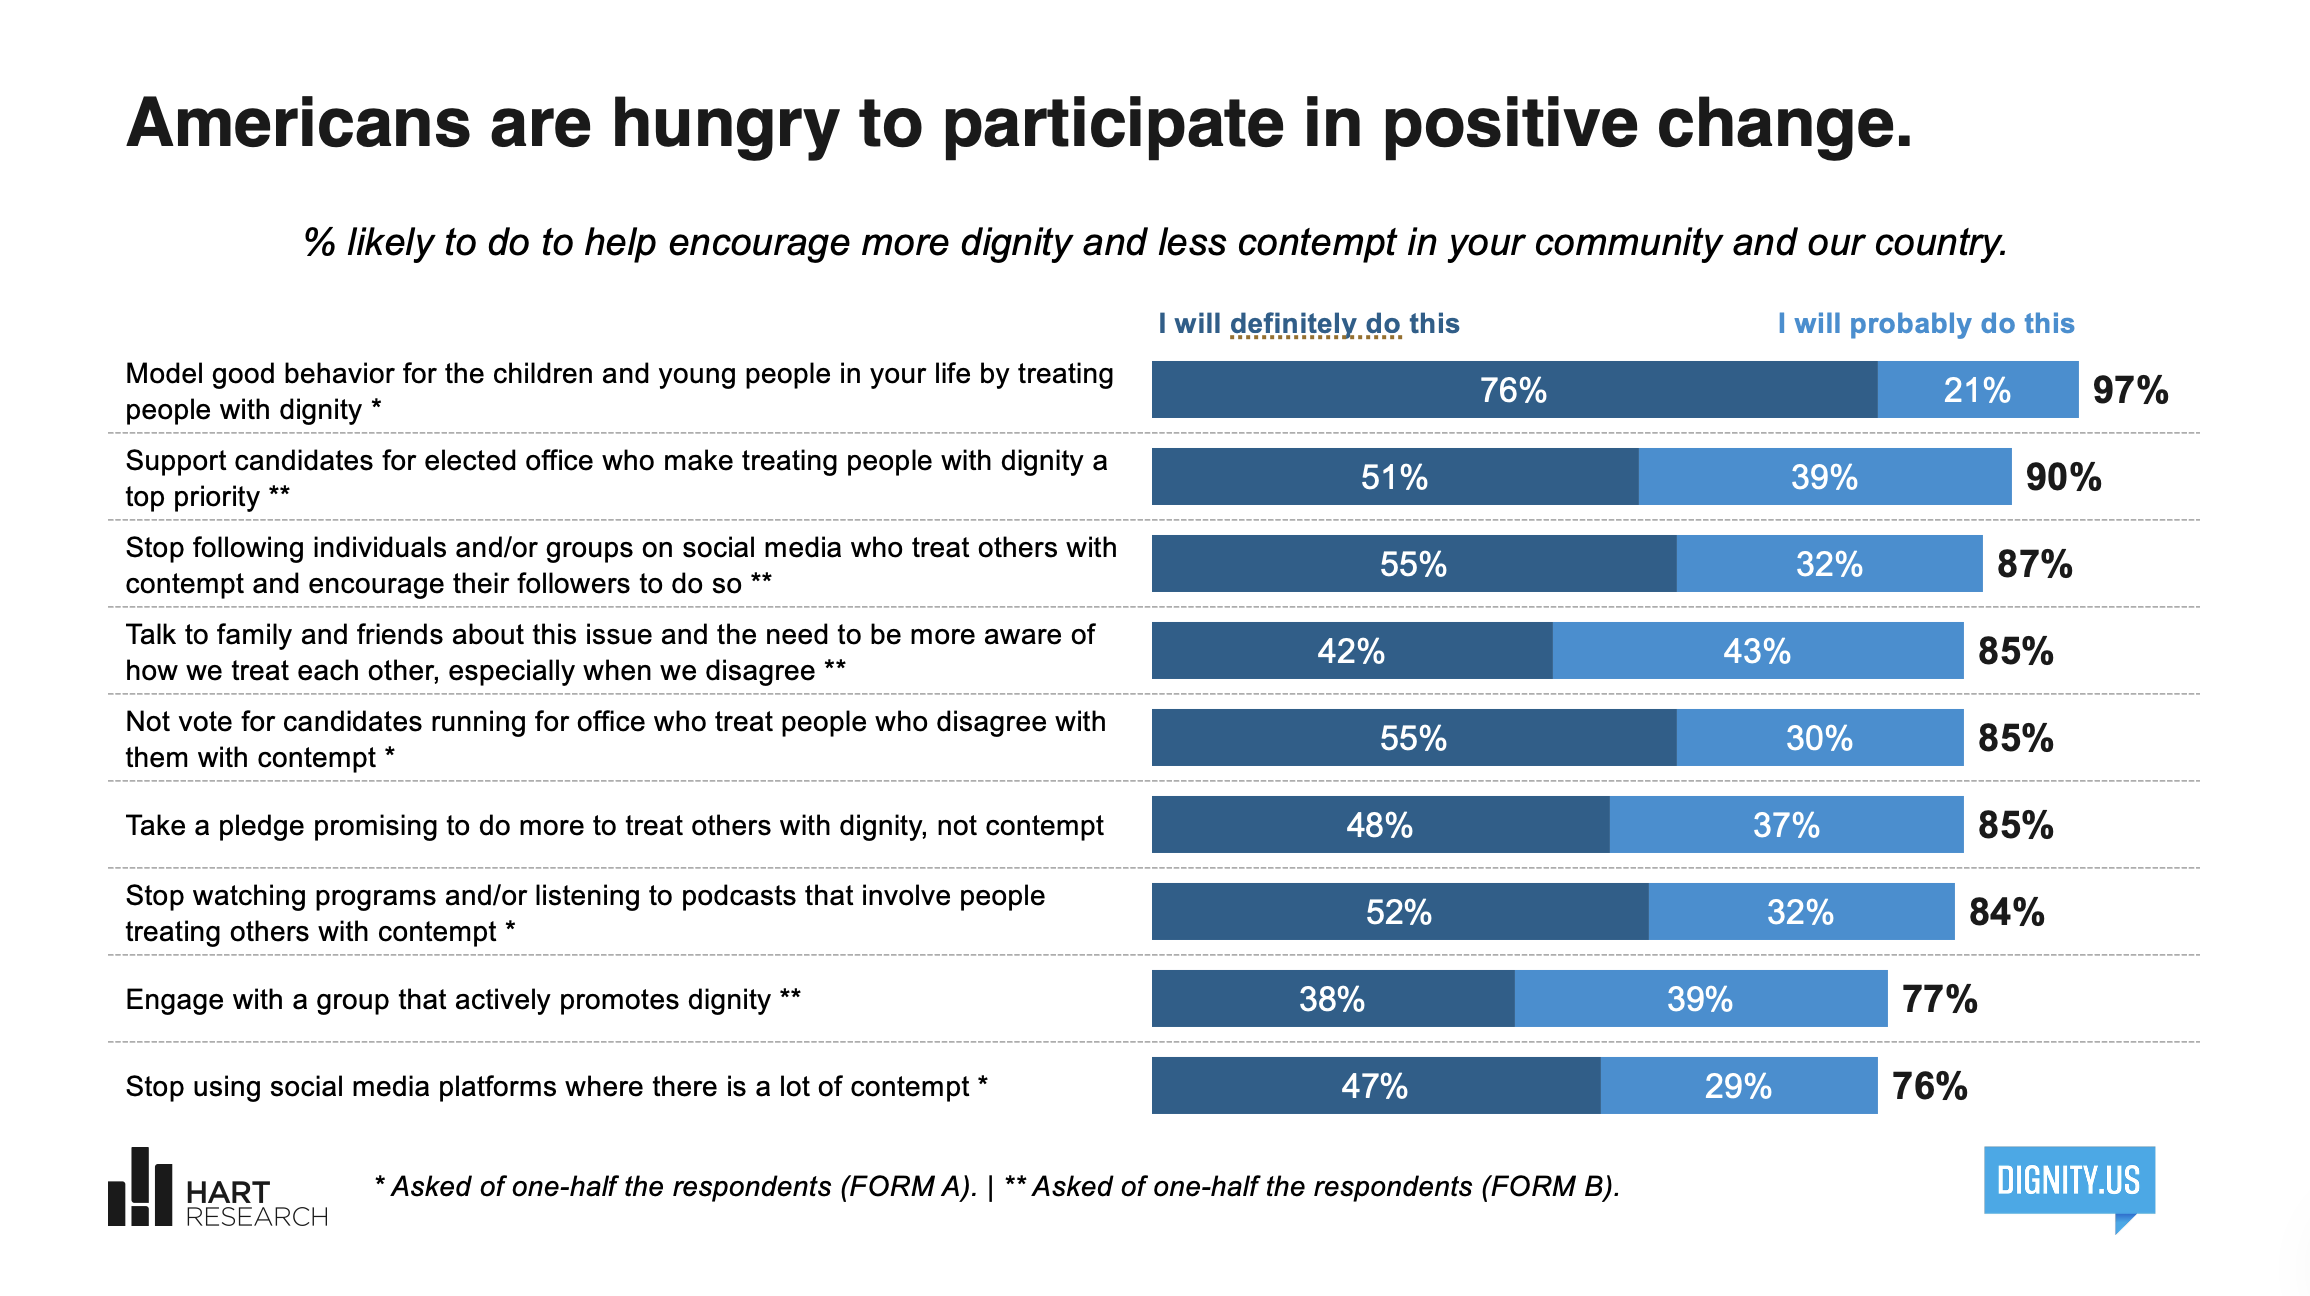
Americans Want to Take Action
-
Polling Firm: Hart Research
Sample Size: N= 1,503 US adults
Fieldwork Dates: February 10-14, 2026
Credibility interval: ±2.5 percentage points for the full sample; higher for subgroups
“The sample is a representative cross-section of adults nationwide. The following characteristics were weighted to be representative of adults, nationwide, based on U.S. Census data: gender, age, race/ethnicity, educational attainment, employment status, and geographic region.”
-
Americans are living during a time of some of the greatest division and pessimism in American history. In this polarized landscape, the country urgently needs a shared framework for addressing toxic division and rebuilding trust.
While existing metrics track economic indicators and public opinion, few systematically measure the relational dynamics that research in psychology and conflict resolution have shown can escalate and de-escalate conflict. Within these fields, substantial evidence demonstrates that contempt corrodes relationships and dignity supports constructive engagement.
This barometer is the first to systematically measure dignity in America. By establishing a rigorous baseline measure of where and how Americans experience dignity and contempt in their daily lives—from politics to workplaces, schools, families, and government institutions – it provides a foundation for lowering the temperature of our public discussions. We believe that changing our national conversations begins with one shared value – that all people should be treated with dignity.
-
In our first annual Dignity Barometer, Americans voice broad agreement: There is an urgent new issue in our country that’s almost as important to them as the cost of living: how we treat each other.
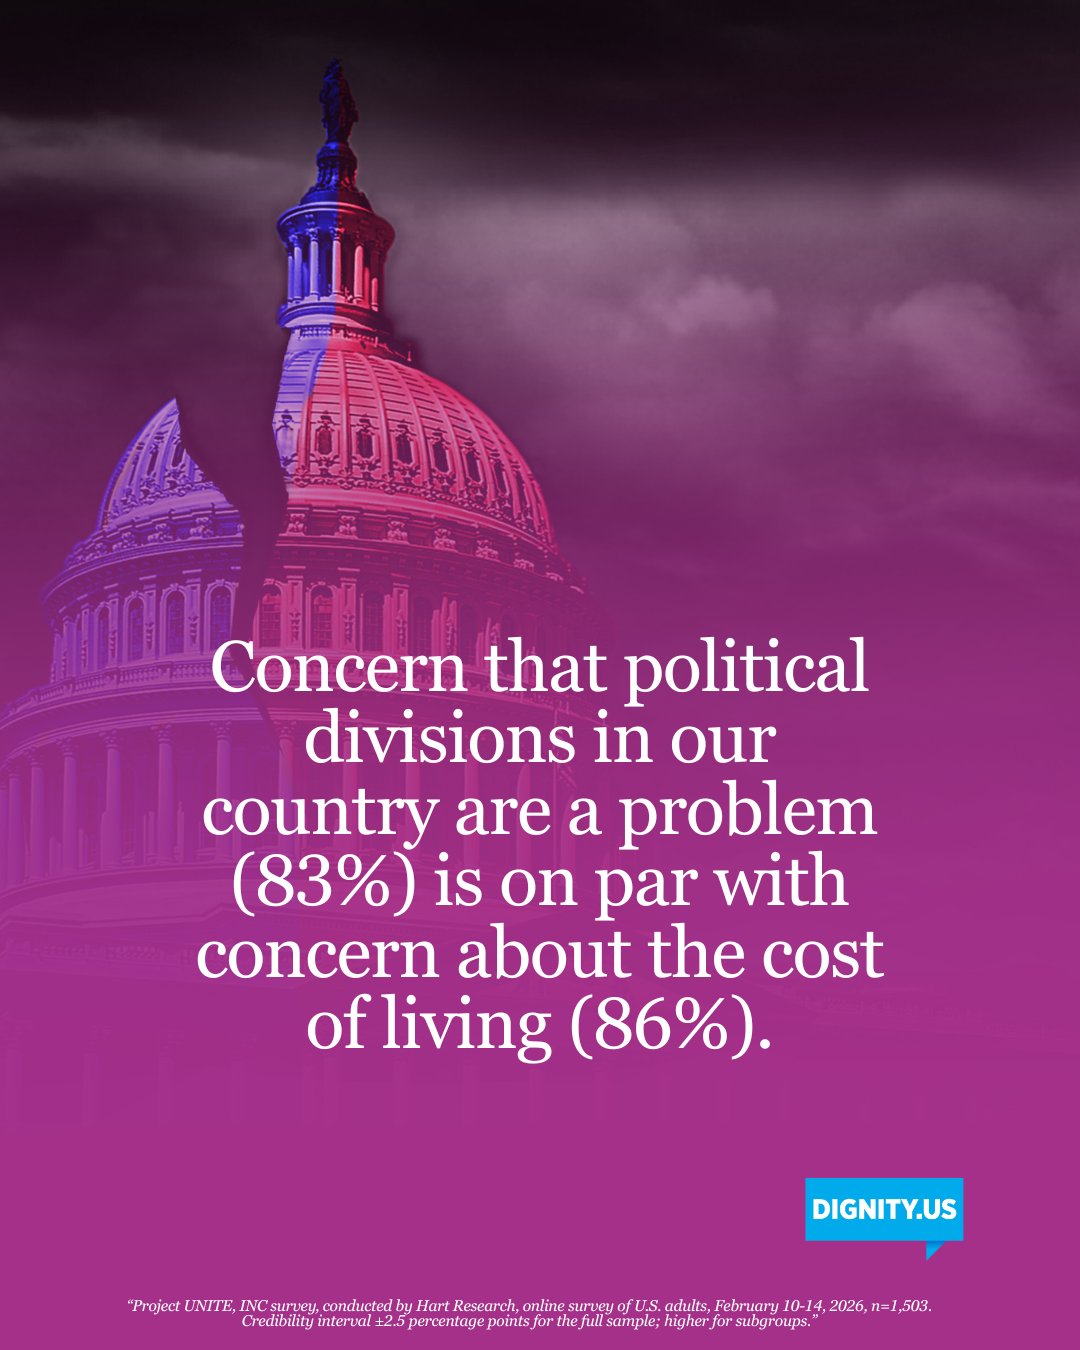
Five in six Americans are worried about our polarization. Two in three believe we’re too divided to solve our problems. And three in four say we’re dissatisfied with the way we treat each other.
These numbers show that our divisions are troubling and destructive, but there is good news in here, too. Americans not only call out the problem, they point to a solution: Perhaps we’re too divided to solve our problems precisely because of the way we’re treating each other.
And this could show us a way out.
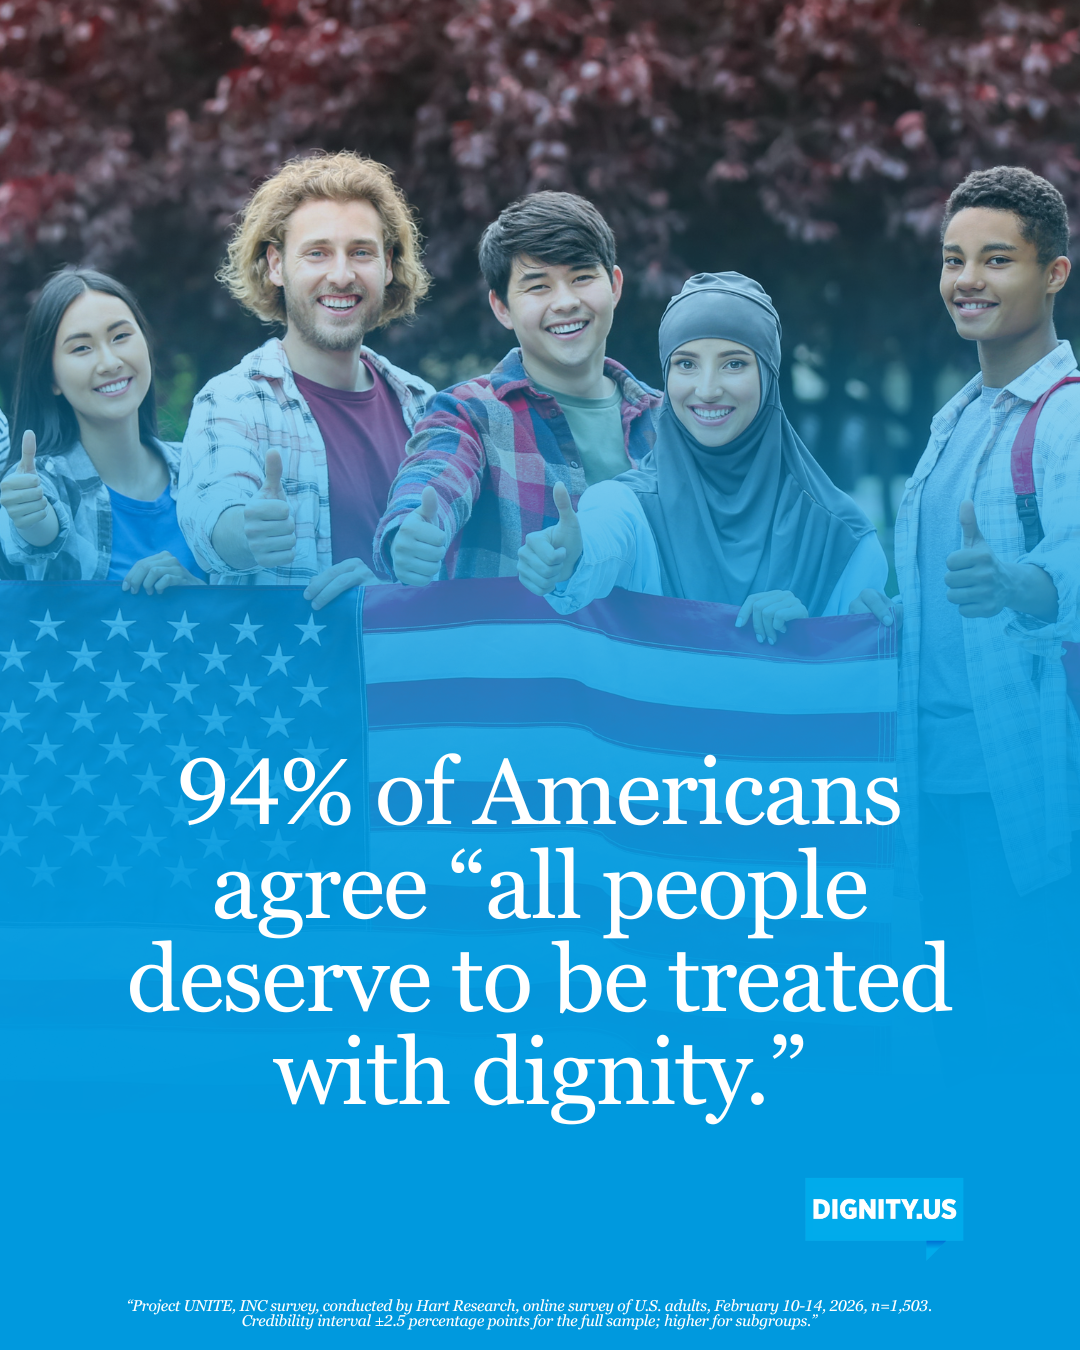
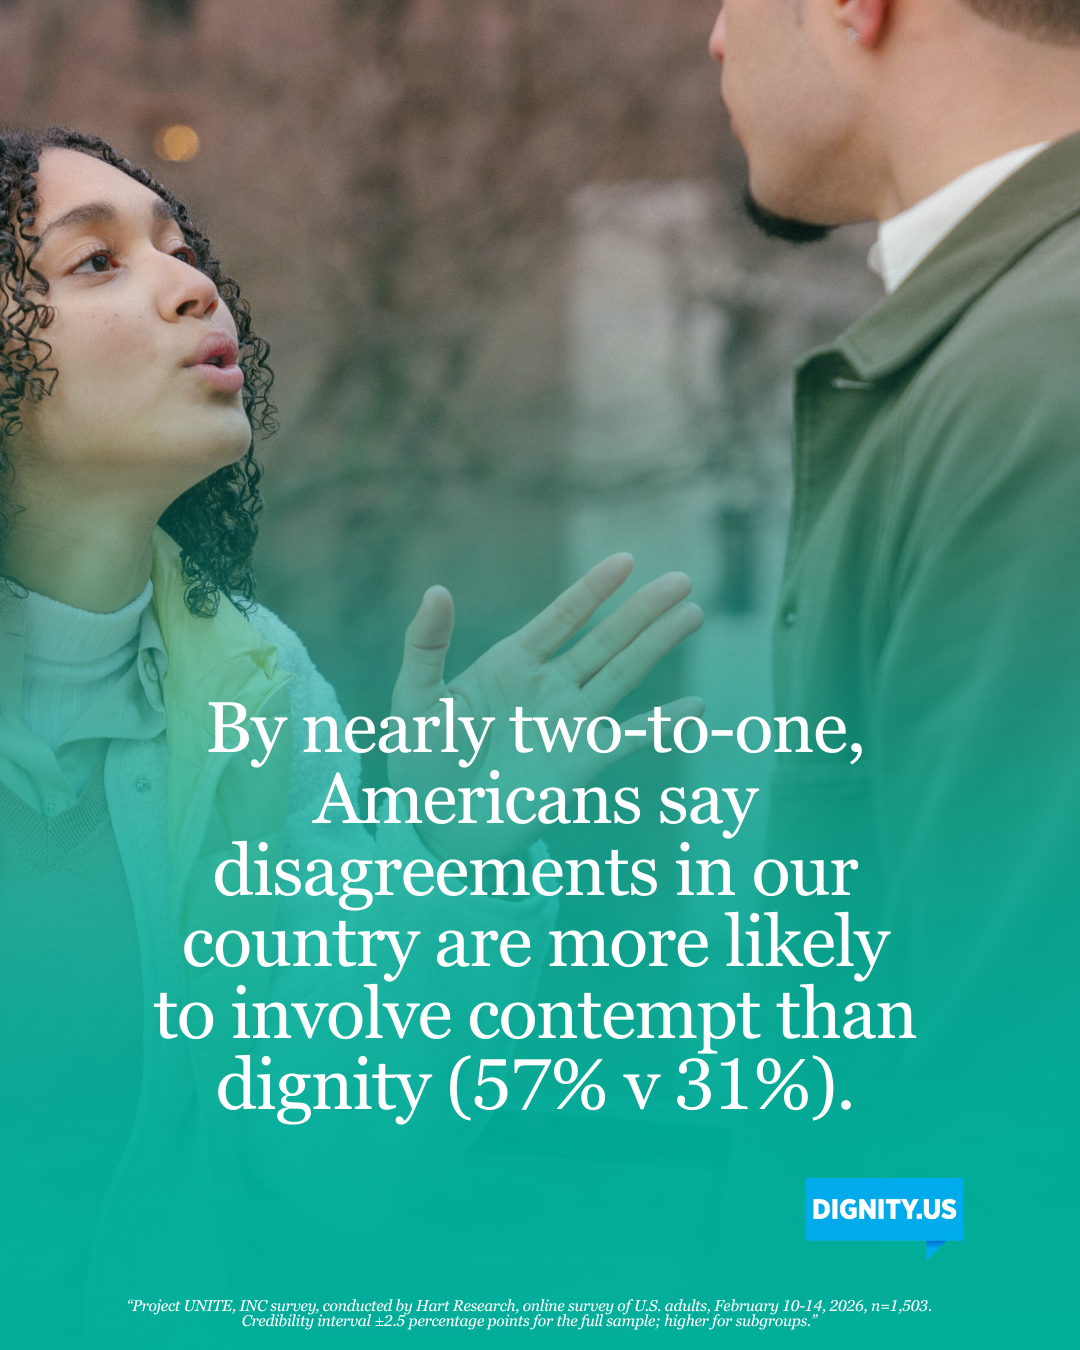
Here’s a shockingly hopeful number from the Barometer: 94 percent of Americans say all people deserve to be treated with dignity. And here is the big challenge: Only 31 percent say that we actually treat each other that way.
We call this TheDignity Gap. We’re not living up to our own values, and that could be a powerful motivator—if we can tie it to our passion for a more perfect union.
Barometer respondents say that dignity is not just an ethical value, it’s also a practical value. Dignity works. Respondents agree that contempt reduces trust, while dignity increases trust. Contempt makes it harder to solve problems, while dignity makes it easier to solve problems. Contempt increases the chance of violence, while dignity reduces the chance of violence.
It all adds up to a singular conclusion: Americans are saying the problem of division is in how we treat each other. And the solution to division… is also in how we treat each other. We’re both the cause and the solution to the problem. And that puts the power in all in our hands.
Nearly eight years ago, we launched our organization with the aim of awakening each other to the dignity in all of us—a dignity we believe is the key to the American spirit. As a small group taking on a huge problem, we knew we needed an idea that we’d all been either missing or minimizing.
So we built our work on the conviction that (1) It’s not our disagreements that cause our division; it’s treating others with contempt when we disagree, and (2) When contempt tears us apart, dignity can bring us back together.
Since 2022, we have brought presentations and conversations on dignity and contempt to city councils, school districts, universities, Governors’ offices, faith groups, corporations, and other organizations. They’ve discovered that looking through the dignity lens shows us not only that contempt causes division and dignity eases division; it shows us why things are broken and how they get fixed.
Looking through the dignity lens can help us close the dignity gap.
Last month, we fielded this first Dignity Barometer for several reasons: to learn how Americans respond to the ideas of dignity and contempt; to track the movement of dignity principles over time; to give us data to guide our work; and to put a spotlight on dignity and contempt.
In nearly four years of public work, we’ve seen that when we shine a light on dignity and contempt, people use more dignity and less contempt. Seeing our own contempt stirs our conscience. Seeing our own dignity inspires us further. Both show us our power to reduce division.
To start making a difference, we don’t need a majority. We don’t even need millions. We just need a trend.
**
We come to this work motivated by personal values and deep patriotism. In 1968, during his campaign for President, Senator Robert Kennedy offered a critique of the Gross National Product, the widely cited measure of economic growth. It had long been accepted as a measure of national well-being, but Kennedy noted that it was too narrow—that it could not measure what makes life worthwhile or why we are proud to be Americans.
The Dignity Barometer is in part a response to that critique. It is designed to measure, and hopefully to help maximize, an element of human life that is indispensable to our flourishing—the human dignity that we see as the key indicator of the future.
We hope the barometer will offer eye-opening insights into the hidden issue of dignity and contempt, which tells the larger story of what’s happening in America today and gives all of us a role to play if we want to be a part of the change.
Tim Shriver, Tom Rosshirt, Tami Pyfer
Help Close the Dignity Gap—Share these findings.